Alterar escala de eixo x no GNUPlot
1. Alterar escala de eixo x no GNUPlot

arsaraiva
(usa Ubuntu)
Enviado em 09/10/2020 - 11:27h
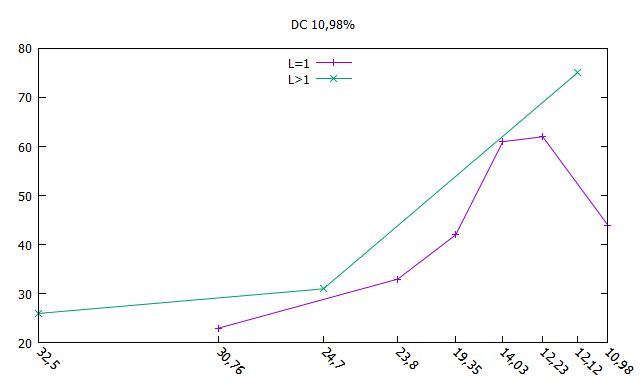
Como não achei o GNUPlot listado em subcategoria e é para inserir o gráfico no Latex, escolhi esta subcategoria. Peço desculpas antecipadas.Estou tentando alterar a escala do eixo x de forma linear, ou seja, que a distância entre os pontos fosse proporcional, assim tenho dois pontos (12,23 e 12,12) que deveriam estar colados e outros como 19,35 com 23,8 que deveriam estar bem espaçados e 23,8 para 24,7 que deveria estar mais próximo, porém não consegui fazer isso corretamente.
reset

set encoding iso_8859_1

set key fixed right top vertical Right noreverse noenhanced autotitle nobox

set style increment default

set datafile missing '-'

set style data linespoints

set xtics border in scale 1,0.5 nomirror rotate by -45 # autojustify

set xtics  norangelimit

set xtics ()

set log x

set key center top inside

set title "DC 5,86%"

set xrange [ * : * ] noreverse writeback

set x2range [ * : * ] noreverse writeback

set yrange [ * : * ] noreverse writeback

set y2range [ * : * ] noreverse writeback

set zrange [ * : * ] noreverse writeback

set cbrange [ * : * ] noreverse writeback

set rrange [ * : * ] noreverse writeback


plot 'teste2.dat' using 2:xtic(1) title columnheader(2),'teste2.dat' using 3:xtic(1) title columnheader(3)
meus dados de entrada são:
DC      L=1    L>1

42.85   15.98   -

32.5        -   26.09

30.76   23.12   -

24.7        -   31.75

23.8    33.1    -

19.35   42.11   -

14.03   61.72   -

12.23   62.65   -

12.12       -   75.38

10.98   44.58   -
Estou penando com isso a algum tempo. Alguém poderia me auxiliar com essa função?
Patrocínio

Destaques
Artigos
O Journal no Linux para a guarda e consulta de logs do sistema
A evolução do Linux e as mudanças que se fazem necessárias desde o seu lançamento
Maquina modesta - a vez dos navegadores ferrarem o usuario
Fscrypt: protegendo arquivos do seu usuário sem a lentidão padrão de criptograr o disco
Dicas
Discos que não instalam o sistema por erro MBR/GPT no Linux
Hospedagem de Mangás com Kavita e Docker para Acesso Remoto via Tailscale
Aplicar tema e ícones do Ubuntu Cinnamon no Arch Linux sem AUR
Tópicos
youtube não está funcionando no linux mint (2)
Instalação do driver Epson L3150 (1)
Continuando meus tópicos anteriores (4)
Top 10 do mês
-

Xerxes
1° lugar - 150.265 pts -

Fábio Berbert de Paula
2° lugar - 76.943 pts -

Buckminster
3° lugar - 47.519 pts -

Alberto Federman Neto.
4° lugar - 43.856 pts -

Alessandro de Oliveira Faria (A.K.A. CABELO)
5° lugar - 33.191 pts -

edps
6° lugar - 31.142 pts -

Sidnei Serra
7° lugar - 26.949 pts -

Mauricio Ferrari (LinuxProativo)
8° lugar - 24.545 pts -

Daniel Lara Souza
9° lugar - 23.013 pts -

Andre (pinduvoz)
10° lugar - 21.798 pts
Scripts
A maior comunidade GNU/Linux da América Latina! Artigos, dicas, tutoriais, fórum, scripts e muito mais. Ideal para quem busca auto-ajuda.
Site hospedado por: